Number of Births in the US
An educational, fair use website
Boom & Bust: Birth Rates in the Twentieth Century
The graph presented is a compilation of 52 data points of time vs. birth rate (per 10,000 23-year old women) in the United States. The years range from 1917–1975. The graph begins in the middle of World War I. At this time people began to recover from the war, and focused on enjoying their new found wealth and freedom -- hence the Roaring 20s. Women became more intent on living their own lives to the fullest rather than procreating for the new generation. These "flappers" experienced new freedom, and a willingness to live their own life, free from child caring.
Click for a larger image or to view the raw data file.
Source: Central Virginia Governor's School for Science and Technology.
The depression then hit the United States in 1929, and there was a local minimum of birth rates for the depression in 1935 at 125.7. Childbirth began to once again pick up as the depression slowly came to an end, and World War II began. However, at the end of World War II, the United States experienced the "Baby Boom" from 1946–1966. Birth rates peaked at the year 1957 at 268.8, and slowly dropped after this. This occurred because of the new found freedoms of women, including the increase of sex among teens and the increased use of drugs. Since the birth rates of this data are of 23-year old women, it is not surprising to see that during the baby boom, birth rates soared amongst young women. After 1960, the birth rates slowly drop off as the baby boom ended. Women became more involved in feminism, and being "tied down to a family" wasn't desired by young women as much as it had been.
This graph accurately depicts the fluctuations of birth rates through the years, and clearly accentuates how the time period change affected women and their desires for children.
Samuel Bernard -- 2002
Multiple Births on the Rise
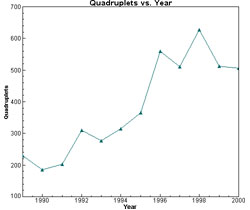
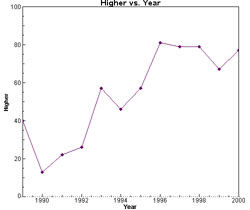
The data for this essay were taken from a report by The National Center for Health Statistics, National Vital Statistics Report, Vol. 50, No.5, February 12, 2002. It can be found online at. In all of the graphs, there is a positive correlation, showing that the number of multiple births occuring over the span of the years between 1989 and 2000 has increased in each of the categories (twins, triplets, quadruplets, and higher). The dramatic rise in multiple births, especially in the triplet, quadruplet, and higher categories can be attributed to advances in and greater access to asssited reproductive medicine. This includes ovulation-inducing drugs and assisted reproductive techniques such as in vitro fertilization. Although these reproductive techniques have helped many women conceive multiple babies, The American College of Obstetricians and Gynecologists and the American Society of Reproductive Medicine issued reports intended to discourage and prevent women from having triple and higher pregnancies because of the elevated risks of poor outcomes.
 |
 |
 |
 |
Leah Oppenheim -- 2002
Data and Story Project-
- Altitude of the highest toy balloon flight
- Angular speed of the earth
- Height of the tallest building
- Highest critical temperature superconductor
- Mass of a dog
- Number of births in the US
- Number of crimes in New York state
- Number of pages in a science review book
- Number of people in the US
- Salary of a baseball player
