More Acceleration Perturbations of Daily Living
An educational, fair use website

Abstract
The purpose of this experiment is to measure the acceleration of the foot, the waist, the chest, and the forehead during various movements.
Introduction
Acceleration is the change of velocity over time. In order to accelerate an object, in this case the body parts, one must use a force to bring about the change in movement. More force equals more acceleration, and each movement requires a different amount of force to perform. Therefore movements that require more force to perform will have a greater acceleration. Acceleration can be easily measured by an accelerometer.
Diagram
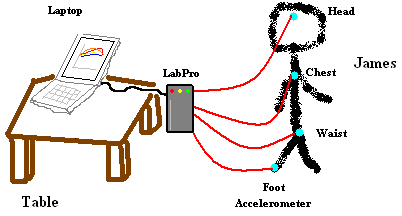
Procedure
- Connect four accelerometers to the following parts of the body, one to each part: foot, waist, chest, and forehead.
- Perform various movements: jump (one foot altitude), frog jump, hop (as with a jump rope), jog, run, walk, and toe lift.
- Find the maximum acceleration for each of the body parts during each movement.
Analysis
The following graphs show the acceleration perturbations of some daily activities. (Click to enlarge.)
 |
 |
 |
 |
 |
 |
 |
This data shows the acceleration of several parts of the body during various movements. In order to find the maximum acceleration, we used the graphs for each movement.
| Body Part |
One Foot Jump | Frog Jump | Hop | Jog | Run | Toe Lift | Walk |
|---|---|---|---|---|---|---|---|
| Foot | 56.15 | 56.15 | 56.41 | 29.57 | 56.41 | 3.648 | 11.82 |
| Waist | 34.02 | 54.39 | 33.77 | 21.5 | 41.44 | 6.176 | 4.105 |
| Chest | 45.87 | 54.54 | 36.99 | 28.82 | 54.96 | 5.841 | 2.454 |
| Head | 37.34 | 18.75 | 27.65 | 14.14 | 40.95 | 3.947 | 2.295 |
Conclusion
The red values indicate the maximum acceleration for each of the body parts, and indicates the movement that brought about the acceleration. The green values indicate the minimal acceleration for each body part, and indicates the movement that brought about the acceleration.
| Body Part |
One Foot Jump | Frog Jump | Hop | Jog | Run | Toe Lift | Walk |
|---|---|---|---|---|---|---|---|
| Foot | 56.15 | 56.15 | 56.41 | 29.57 | 56.41 | 3.648 | 11.82 |
| Waist | 34.02 | 54.39 | 33.77 | 21.5 | 41.44 | 6.176 | 4.105 |
| Chest | 45.87 | 54.54 | 36.99 | 28.82 | 54.96 | 5.841 | 2.454 |
| Head | 37.34 | 18.75 | 27.65 | 14.14 | 40.95 | 3.947 | 2.295 |
Sources of Error
The accelerometer might not have been completely vertical, therefore making the reading less than if it was vertical. The movement of clothing while performing the activities could skew the data by either decreasing or increasing the acceleration.
James Kim, Maté Nagy -- 2006
Hey. There's more!
Haven't had enough of this topic? Check out the original 2005 entry on Acceleration Perturbations of Everyday Living.
Students Choice: